
Hey there! My name is Katherine Larson and I joined on as a Data Scientist in July 2016, though I had been interning with the firm since 2014. Since my first internship with Booz Allen, it’s been embedded in my head that data is the key to everything. All the trends in the data hold meaning, but it’s up to us to discover what that meaning is through data science techniques.
While I think I’ve mastered manipulating pandas dataframes, what I want more experience in is data visualization, particularly mapping. So, I searched the very popular Kaggle to find a dataset that had coordinates. I located a dataset that not only had coordinates, but also had dates. Dates within a dataset are incredibly vital because it allows us to track trends over time – after all everything is changing every day. The data was taken from the NTSB aviation accident database. It includes all aviation accidents reported in the United States, its territories and possessions, and in international waters. I plan on examining a variation of the 31 features included to consider what patterns tend to be prevalent during an accident. The data contains accidents as recent as 2017 and as far back as 1962. Datasets involving accidents and fatalities are important for data scientists to investigate because with enough data, we may one day be able to prevent them.
Data: https://www.kaggle.com/khsamaha/aviation-accident-database-synopses
| Event.Id | Investigation.Type | Accident.Number | Event.Date | Location | Country | Latitude | Longitude | Airport.Code | Airport.Name | Injury.Severity | Aircraft.Damage | Aircraft.Category | Registration.Number | Make | Model | Amateur.Built | Number.of.Engines | Engine.Type | FAR.Description | Schedule | Purpose.of.Flight | Air.Carrier | Total.Fatal.Injuries | Total.Serious.Injuries | Total.Minor.Injuries | Total.Uninjured | Weather.Condition | Broad.Phase.of.Flight | Report.Status | Publication.Date | |
|---|---|---|---|---|---|---|---|---|---|---|---|---|---|---|---|---|---|---|---|---|---|---|---|---|---|---|---|---|---|---|---|
| 0 | 20170103X43747 | Accident | WPR17LA046 | 2017-01-03 | Paradise, MT | United States | NaN | NaN | NaN | NaN | Non-Fatal | Substantial | Airplane | N710XP | SOFTEX INVEST LLC | V-24L | Yes | NaN | Reciprocating | Part 91: General Aviation | NaN | Personal | NaN | NaN | 2.0 | NaN | NaN | VMC | CRUISE | Preliminary | 05/01/2017 |
| 1 | 20161230X55950 | Accident | WPR17FA044 | 2016-12-29 | Dabob, WA | United States | 47.823611 | -122.790000 | NaN | NaN | Fatal(4) | Substantial | Airplane | N52388 | CESSNA | 182 | No | 1.0 | Reciprocating | Part 91: General Aviation | NaN | Personal | NaN | 4.0 | NaN | NaN | NaN | VMC | NaN | Preliminary | 05/01/2017 |
| 2 | 20161229X93022 | Accident | CEN17LA062 | 2016-12-27 | Piedmont, MO | United States | NaN | NaN | NaN | NaN | Non-Fatal | Substantial | Airplane | N5499Z | PIPER | PA22 | No | 1.0 | Reciprocating | Part 91: General Aviation | NaN | Personal | NaN | NaN | NaN | NaN | 1.0 | VMC | LANDING | Preliminary | 03/01/2017 |
| 3 | 20161227X80237 | Accident | CEN17LA061 | 2016-12-27 | Farmington, MO | United States | 37.761111 | -90.428611 | FAM | FARMINGTON RGNL | Non-Fatal | Substantial | Airplane | N918KS | MEAD | RV 8A | Yes | NaN | NaN | Part 91: General Aviation | NaN | Personal | NaN | NaN | NaN | 1.0 | 1.0 | VMC | TAKEOFF | Preliminary | 29/12/2016 |
| 4 | 20161226X80840 | Accident | WPR17FA041 | 2016-12-26 | Fresno, CA | United States | 36.844444 | -119.870834 | E79 | Sierra Sky Park | Fatal(2) | Destroyed | Airplane | N176PA | PETRUS DAVID WAYNE | S90 | Yes | NaN | Reciprocating | Part 91: General Aviation | NaN | Personal | NaN | 2.0 | NaN | NaN | NaN | VMC | TAKEOFF | Preliminary | 05/01/2017 |
Initial Analysis
The total number of accidents included in the dataset are 79293.
Upon first glance of the data it is very evident that not all fields are always reported for each accident. For the columns that seemed most likely to hold significance, I looked at the possible responses for that column as well as the total number of responses that the column actually had.
print(data.columns)
Index([u'Event.Id', u'Investigation.Type', u'Accident.Number', u'Event.Date',

u'Location', u'Country', u'Latitude', u'Longitude', u'Airport.Code',

u'Airport.Name', u'Injury.Severity', u'Aircraft.Damage',

u'Aircraft.Category', u'Registration.Number', u'Make', u'Model',

u'Amateur.Built', u'Number.of.Engines', u'Engine.Type',

u'FAR.Description', u'Schedule', u'Purpose.of.Flight', u'Air.Carrier',

u'Total.Fatal.Injuries', u'Total.Serious.Injuries',

u'Total.Minor.Injuries', u'Total.Uninjured', u'Weather.Condition',

u'Broad.Phase.of.Flight', u'Report.Status', u'Publication.Date'],

dtype='object')
interesting_cols = ['Injury.Severity', 'Aircraft.Damage', 'Aircraft.Category', 'Amateur.Built', 'Number.of.Engines', 'FAR.Description', 'Weather.Condition', 'Broad.Phase.of.Flight']

for col in interesting_cols:

data_sub = data.dropna(subset=[col])

print(col)

print("Possible Responses")

print(str(pd.unique(data_sub[col])))

print("Number of responses: " + str(len(data_sub)))

print("-------------------------------------------")
Injury.Severity

Possible Responses

['Non-Fatal' 'Fatal(4)' 'Fatal(2)' 'Fatal(3)' 'Fatal(1)' 'Incident'

'Unavailable' 'Fatal(6)' 'Fatal(5)' 'Fatal(8)' 'Fatal(16)' 'Fatal(66)'

'Fatal(7)' 'Fatal(62)' 'Fatal(23)' 'Fatal(10)' 'Fatal(9)' 'Fatal(224)'

'Fatal(150)' 'Fatal(43)' 'Fatal(162)' 'Fatal(58)' 'Fatal(295)' 'Fatal(11)'

'Fatal(239)' 'Fatal(33)' 'Fatal(50)' 'Fatal(14)' 'Fatal(21)' 'Fatal(19)'

'Fatal(153)' 'Fatal(127)' 'Fatal(28)' 'Fatal(77)' 'Fatal(12)' 'Fatal(42)'

'Fatal(157)' 'Fatal(158)' 'Fatal(103)' 'Fatal(89)' 'Fatal(90)'

'Fatal(152)' 'Fatal(228)' 'Fatal(17)' 'Fatal(13)' 'Fatal(24)' 'Fatal(88)'

'Fatal(65)' 'Fatal(154)' 'Fatal(30)' 'Fatal(20)' 'Fatal(40)' 'Fatal(57)'

'Fatal(199)' 'Fatal(114)' 'Fatal(102)' 'Fatal(96)' 'Fatal(49)'

'Fatal(124)' 'Fatal(113)' 'Fatal(107)' 'Fatal(117)' 'Fatal(145)'

'Fatal(45)' 'Fatal(160)' 'Fatal(121)' 'Fatal(15)' 'Fatal(104)' 'Fatal(25)'

'Fatal(55)' 'Fatal(46)' 'Fatal(141)' 'Fatal(115)' 'Fatal(75)' 'Fatal(71)'

'Fatal(206)' 'Fatal(138)' 'Fatal(92)' 'Fatal(26)' 'Fatal(265)'

'Fatal(118)' 'Fatal(44)' 'Fatal(64)' 'Fatal(18)' 'Fatal(83)' 'Fatal(143)'

'Fatal(60)' 'Fatal(131)' 'Fatal(169)' 'Fatal(217)' 'Fatal(80)'

'Fatal(229)' 'Fatal(87)' 'Fatal(52)' 'Fatal(97)' 'Fatal(35)' 'Fatal(29)'

'Fatal(125)' 'Fatal(349)' 'Fatal(34)' 'Fatal(70)' 'Fatal(230)'

'Fatal(110)' 'Fatal(123)' 'Fatal(189)' 'Fatal(72)' 'Fatal(54)' 'Fatal(68)'

'Fatal(132)' 'Fatal(37)' 'Fatal(56)' 'Fatal(47)' 'Fatal(27)' 'Fatal(73)'

'Fatal(111)' 'Fatal(174)' 'Fatal(144)' 'Fatal(270)' 'Fatal(156)'

'Fatal(82)' 'Fatal(256)' 'Fatal(31)' 'Fatal(135)' 'Fatal(78)']

Number of responses: 79293

-------------------------------------------

Aircraft.Damage

Possible Responses

['Substantial' 'Destroyed' 'Minor']

Number of responses: 76883

-------------------------------------------

Aircraft.Category

Possible Responses

['Airplane' 'Helicopter' 'Weight-Shift' 'Glider' 'Unknown' 'Balloon'

'Powered Parachute' 'Ultralight' 'Gyroplane' 'Gyrocraft' 'Powered-Lift'

'Rocket' 'Blimp']

Number of responses: 22477

-------------------------------------------

Amateur.Built

Possible Responses

['Yes' 'No']

Number of responses: 78721

-------------------------------------------

Number.of.Engines

Possible Responses

[ 1. 2. 0. 4. 3. 18.]

Number of responses: 75175

-------------------------------------------

FAR.Description

Possible Responses

['Part 91: General Aviation' 'Part 135: Air Taxi & Commuter'

'Public Aircraft' 'Part 121: Air Carrier' 'Unknown'

'Non-U.S., Non-Commercial' 'Part 137: Agricultural' 'Non-U.S., Commercial'

'Part 103: Ultralight' 'Part 133: Rotorcraft Ext. Load' 'Public Use'

'Part 129: Foreign' 'Armed Forces' 'Part 437: Commercial Space Flight'

'Part 91 Subpart K: Fractional' 'Part 125: 20+ Pax,6000+ lbs'

'Part 91F: Special Flt Ops.']

Number of responses: 22334

-------------------------------------------

Weather.Condition

Possible Responses

['VMC' 'IMC' 'UNK']

Number of responses: 77136

-------------------------------------------

Broad.Phase.of.Flight

Possible Responses

['CRUISE' 'LANDING' 'TAKEOFF' 'DESCENT' 'APPROACH' 'OTHER' 'TAXI'

'GO-AROUND' 'MANEUVERING' 'UNKNOWN' 'STANDING' 'CLIMB']

Number of responses: 73239

-------------------------------------------
The total number of responses for each column displays the amount of data lost if I were to take certain subsets. For example, if I wanted to look at the Aircraft Category, I would realize that I only have 22,477 responses for the 79,293 total accidents. However, a field such as weather condition has 77,136 responses which gives a better representation of the entire dataset.
Data Cleanup
# Separating the date column into year, month, day

data['year'], data['month'], data['day'] = zip(*data['Event.Date'].map(lambda x: str(x).split('-')))
# Changing the fatal column to 'Non-Fatal', 'None', 'Fatal', or 'Unknown', and adding a 'Fatal_Count' in a separate column

import re

import numpy as np

fatal_counts = []

fatal_bools = []

for i in range(len(data)):

fatal_resp = data.iloc[i]['Injury.Severity']

if str(fatal_resp) == 'Non-Fatal':

fatal_counts.append(0)

fatal_bools.append("None")

elif fatal_resp is not None:

num = re.sub(r'\D', "", str(fatal_resp))

if num == "":

fatal_counts.append(np.nan)

fatal_bools.append("Unknown")

else:

fatal_counts.append(int(num))

fatal_bools.append("Fatal")

else:

fatal_counts.append(np.nan)

fatal_bools.append("Unknown")

data['Fatal_Counts'] = fatal_counts

data['Fatal_Bool'] = fatal_bools
New cleaned up data
| Event.Id | Investigation.Type | Accident.Number | Event.Date | Location | Country | Latitude | Longitude | Airport.Code | Airport.Name | Injury.Severity | Aircraft.Damage | Aircraft.Category | Registration.Number | Make | Model | Amateur.Built | Number.of.Engines | Engine.Type | FAR.Description | Schedule | Purpose.of.Flight | Air.Carrier | Total.Fatal.Injuries | Total.Serious.Injuries | Total.Minor.Injuries | Total.Uninjured | Weather.Condition | Broad.Phase.of.Flight | Report.Status | Publication.Date | year | month | day | Fatal_Counts | Fatal_Bool | |
|---|---|---|---|---|---|---|---|---|---|---|---|---|---|---|---|---|---|---|---|---|---|---|---|---|---|---|---|---|---|---|---|---|---|---|---|---|
| 0 | 20170103X43747 | Accident | WPR17LA046 | 2017-01-03 | Paradise, MT | United States | NaN | NaN | NaN | NaN | Non-Fatal | Substantial | Airplane | N710XP | SOFTEX INVEST LLC | V-24L | Yes | NaN | Reciprocating | Part 91: General Aviation | NaN | Personal | NaN | NaN | 2.0 | NaN | NaN | VMC | CRUISE | Preliminary | 05/01/2017 | 2017 | 01 | 03 | 0.0 | None |
| 1 | 20161230X55950 | Accident | WPR17FA044 | 2016-12-29 | Dabob, WA | United States | 47.823611 | -122.790000 | NaN | NaN | Fatal(4) | Substantial | Airplane | N52388 | CESSNA | 182 | No | 1.0 | Reciprocating | Part 91: General Aviation | NaN | Personal | NaN | 4.0 | NaN | NaN | NaN | VMC | NaN | Preliminary | 05/01/2017 | 2016 | 12 | 29 | 4.0 | Fatal |
| 2 | 20161229X93022 | Accident | CEN17LA062 | 2016-12-27 | Piedmont, MO | United States | NaN | NaN | NaN | NaN | Non-Fatal | Substantial | Airplane | N5499Z | PIPER | PA22 | No | 1.0 | Reciprocating | Part 91: General Aviation | NaN | Personal | NaN | NaN | NaN | NaN | 1.0 | VMC | LANDING | Preliminary | 03/01/2017 | 2016 | 12 | 27 | 0.0 | None |
| 3 | 20161227X80237 | Accident | CEN17LA061 | 2016-12-27 | Farmington, MO | United States | 37.761111 | -90.428611 | FAM | FARMINGTON RGNL | Non-Fatal | Substantial | Airplane | N918KS | MEAD | RV 8A | Yes | NaN | NaN | Part 91: General Aviation | NaN | Personal | NaN | NaN | NaN | 1.0 | 1.0 | VMC | TAKEOFF | Preliminary | 29/12/2016 | 2016 | 12 | 27 | 0.0 | None |
| 4 | 20161226X80840 | Accident | WPR17FA041 | 2016-12-26 | Fresno, CA | United States | 36.844444 | -119.870834 | E79 | Sierra Sky Park | Fatal(2) | Destroyed | Airplane | N176PA | PETRUS DAVID WAYNE | S90 | Yes | NaN | Reciprocating | Part 91: General Aviation | NaN | Personal | NaN | 2.0 | NaN | NaN | NaN | VMC | TAKEOFF | Preliminary | 05/01/2017 | 2016 | 12 | 26 | 2.0 | Fatal |
len(data[data['Fatal_Counts'] > 0])

15873
There are 15,873 accidents that had at least one fatality.
Analysis
Using Bokeh, I am going to create some visualizations to see what patterns are associated with fatal aircraft accidents. I am going to take a subset of the data with some features I think would yield intersting results, while also keeping in mind how these trends may be changing over time.
from bokeh.charts import HeatMap, output_file, show

from bokeh.charts import HeatMap, bins, output_file, show

from bokeh.layouts import column, gridplot
# Features to consider

features = ['Location', 'Country', 'Latitude', 'Longitude', 'Aircraft.Damage', 'Make', 'Model', 'Amateur.Built', 'Number.of.Engines', 'Engine.Type', 'FAR.Description', 'Purpose.of.Flight', 'Total.Uninjured', 'Weather.Condition', 'Broad.Phase.of.Flight', 'year', 'month', 'Fatal_Counts', 'Fatal_Bool']
# Taking the subset

my_data = data[features]
# Function to create heatmap

def heatmap(df, category):

temp = df[[category, 'year', 'Fatal_Counts']]

temp = temp.dropna()

temp = temp[temp['Fatal_Counts'] > 0]

years = []

descs = []

fat_sum = []

for k,g in temp.groupby(['year', category]):

(year, desc) = k

sum_fatal = sum(g['Fatal_Counts'])

years.append(year)

descs.append(desc)

fat_sum.append(sum_fatal)

dict_to_plot = {

'year':years,

category:descs,

'fatal':fat_sum

}

print (len(years))

return dict_to_plot
# Fatalities By Description

print("Accidents with at least one fatality for FAR.Description")

desc_map = HeatMap(heatmap(my_data,'FAR.Description'), y='year', x='FAR.Description', values='fatal', stat=None)

show(desc_map)

# Fatalities By Weather Condition

print("Accidents with at least one fatality for Weather Condition")

weather_map = HeatMap(heatmap(my_data,'Weather.Condition'), y='year', x='Weather.Condition', values='fatal', stat=None)

show(weather_map)

# Fatalities By Make

print("Accidents with at least one fatality Phase of Flight")

phase_map = HeatMap(heatmap(my_data, 'Broad.Phase.of.Flight'), y='year', x='Broad.Phase.of.Flight', values ='fatal', stat=None)

show(phase_map)

# Fatalities By Purpose

print("Accidents with at least one fatality for Purpose")

purpose_map = HeatMap(heatmap(my_data, 'Purpose.of.Flight'), y='year', x='Purpose.of.Flight', values ='fatal', stat=None)

show(purpose_map)

# Aircraft Damage

print("Accidents with at least one fatality for Aircraft Damage")

damage_map = HeatMap(heatmap(my_data, 'Aircraft.Damage'), y='year', x='Aircraft.Damage', values ='fatal', stat=None)

show(damage_map)
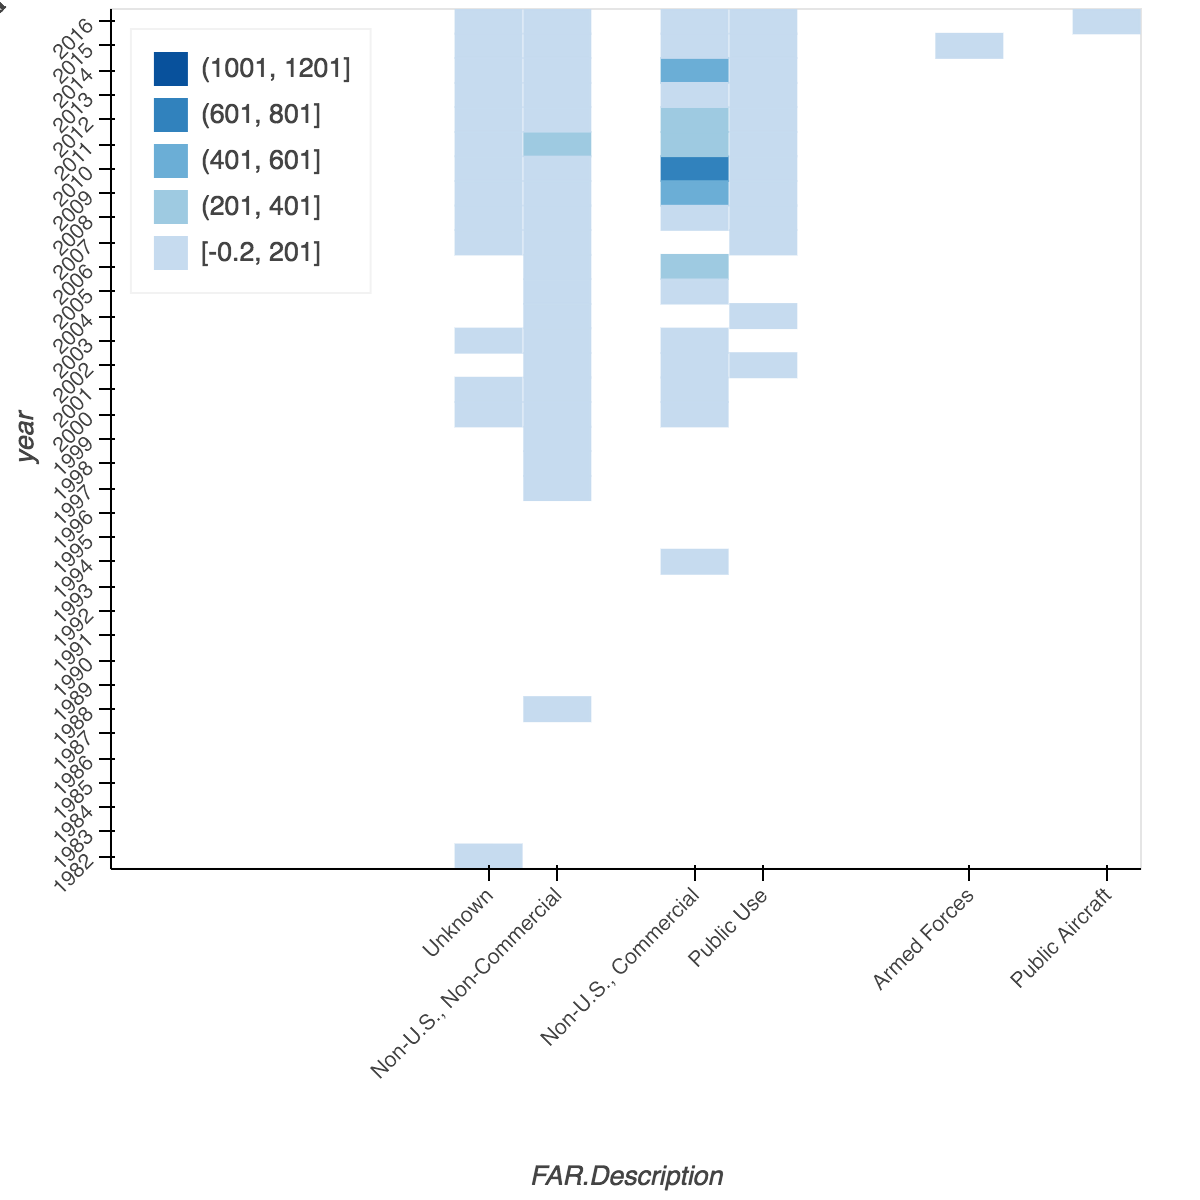
Accidents with at least one fatality for FAR.Description: 165
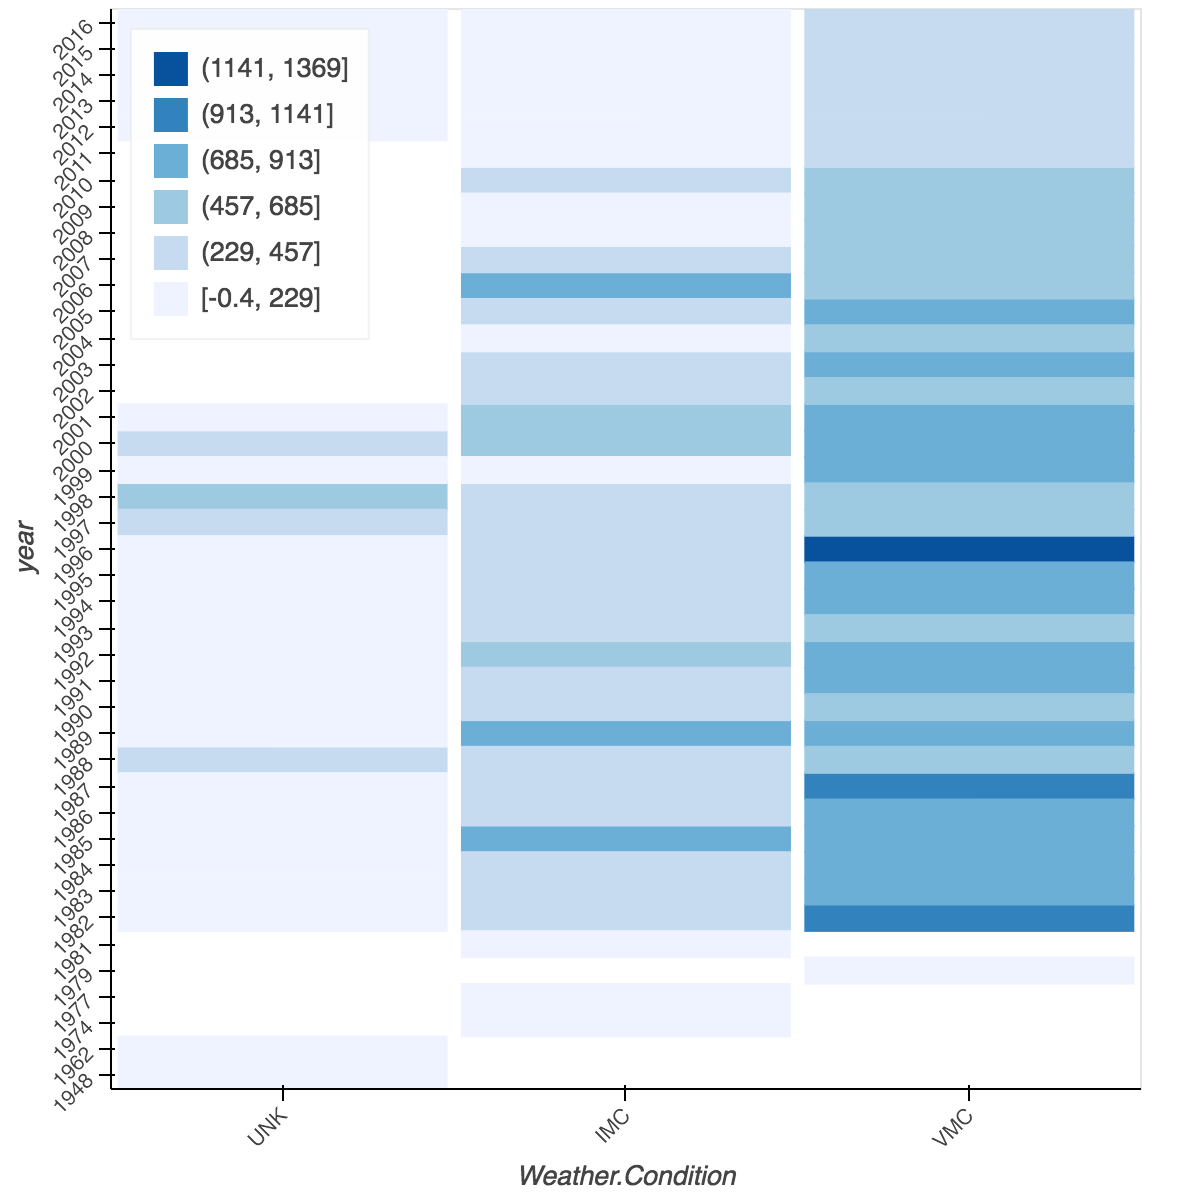
Accidents with at least one fatality for Weather Condition: 101
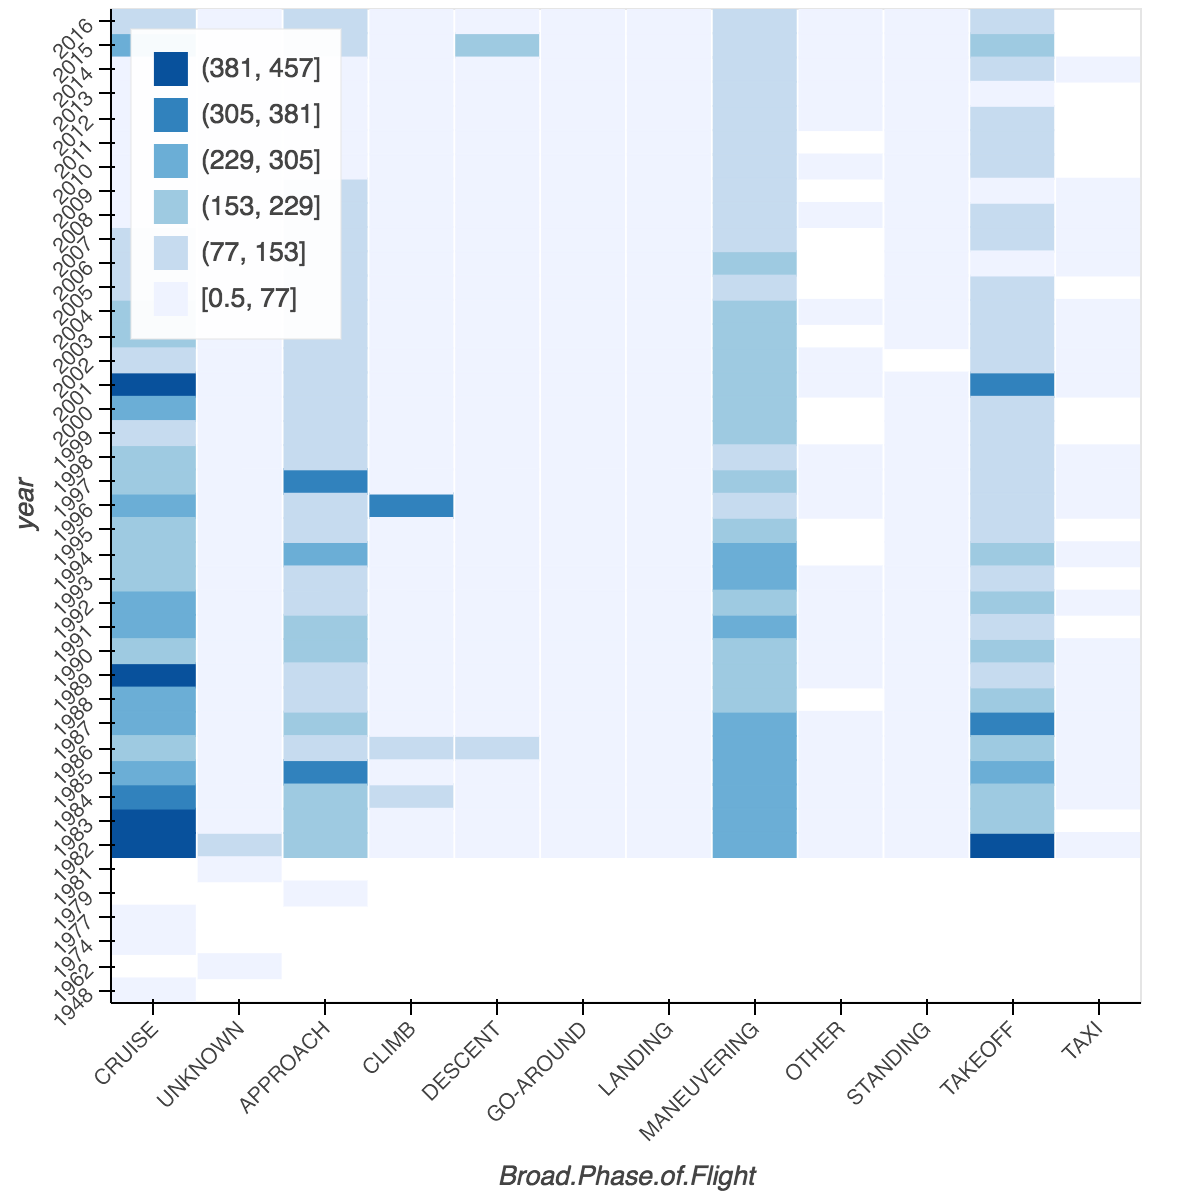
Accidents with at least one fatality Phase of Flight: 401
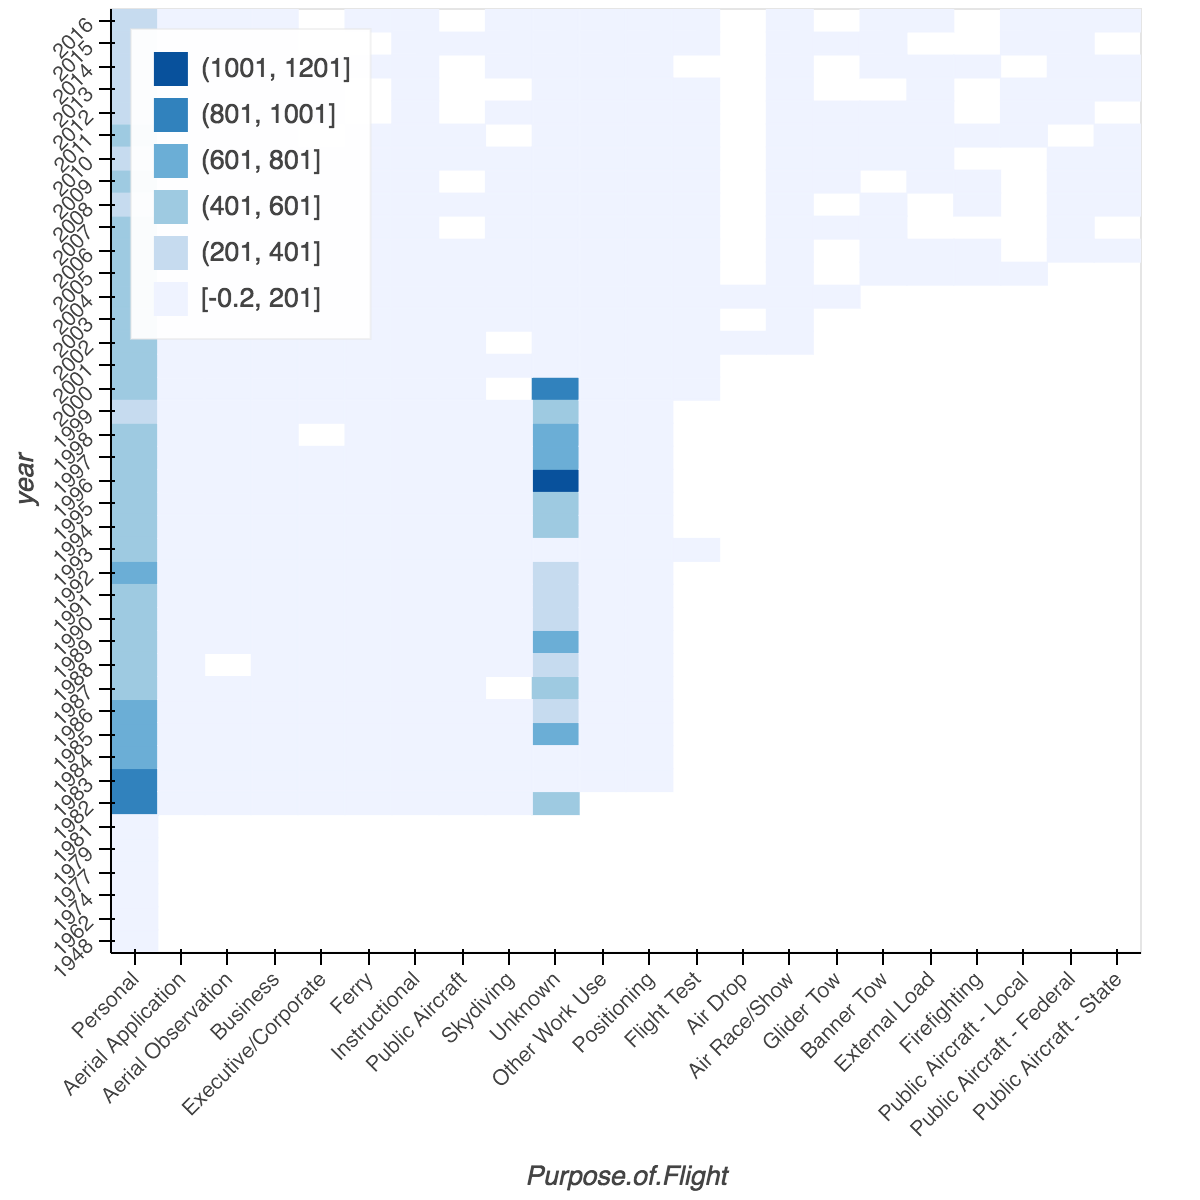
Accidents with at least one fatality for Purpose: 495
Accidents with at least one fatality for Aircraft Damage: 110
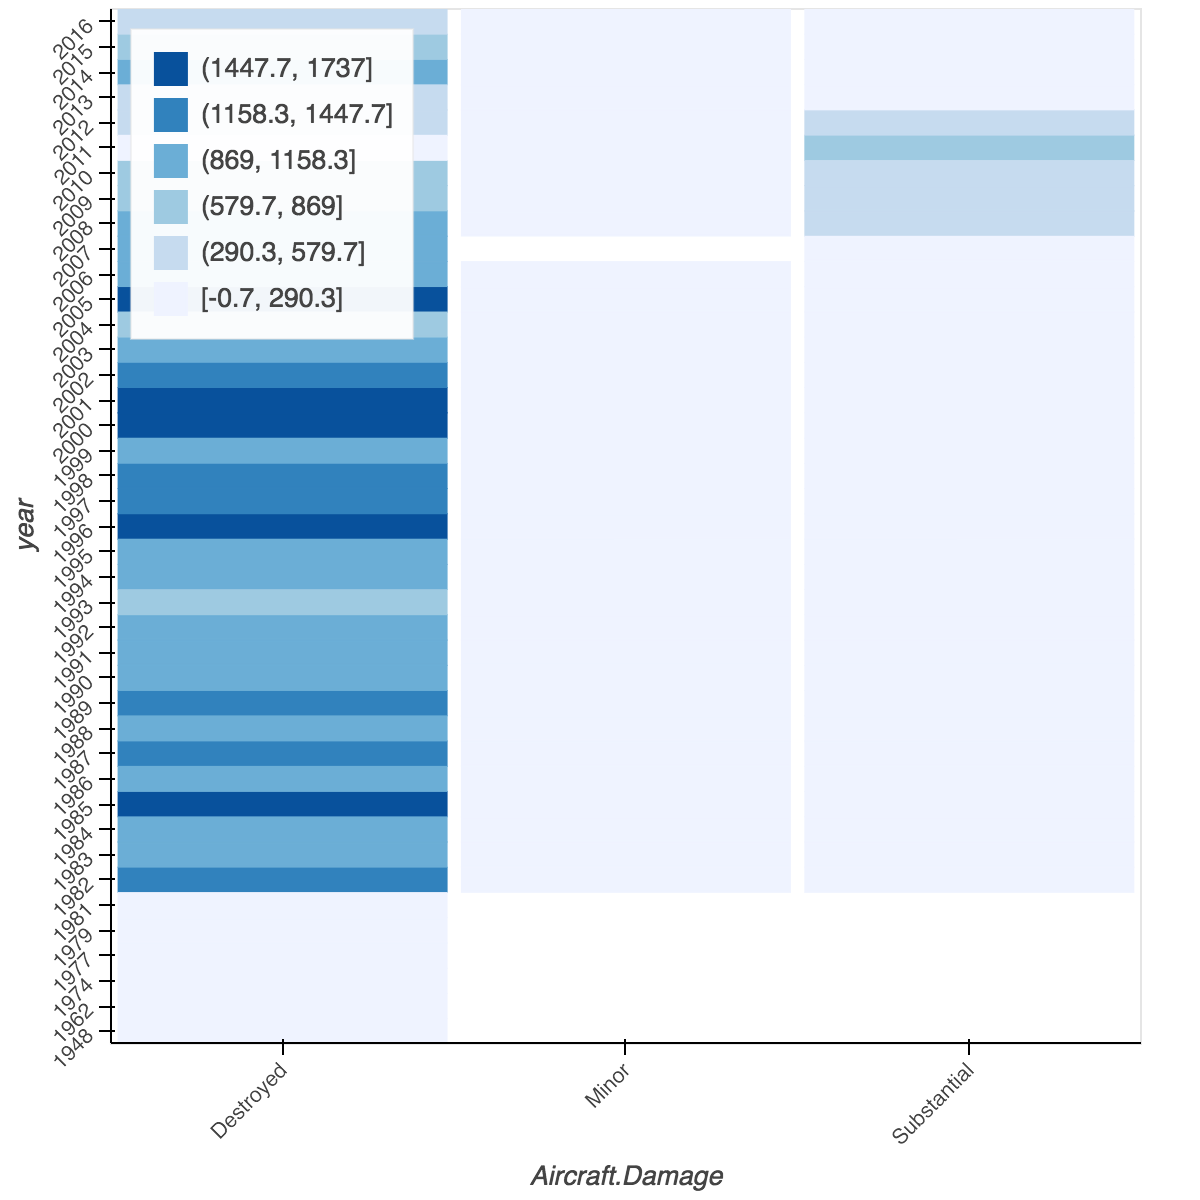
These graphs only took into consideration flights which had at least one fatality. For most of the graphs, at least one column is definitively darker than the rest, meaning more fatalities occur during those circumstances.
For example, in Weather Condition, most accidents with a fatality occurred when the weather was ‘VMC’. So, I went back to the possible responses for weather. These responses include: VMC, IMC, or UNK. After some research with the NTSB database, I learned that VMC represents “weather conditions in which pilots have sufficient visibility to fly the aircraft maintaining visual separation from terrain and other aircraft”, while IMC represents, “weather conditions that require pilots to fly primarily by reference to instruments, and therefore under instrument flight rules (IFR), rather than by outside visual references under visual flight rules”. Meaning, over the years it has been consistent that most accidents with fatalities occur when the pilot has full control of the aircraft rather than when the pilot is relying on the plane’s instruments.
When considering phase of flight, more than one column is visibly darker than the rest, with ‘cruise’ standing out the most by just a bit. “Cruise” signifies the phase of flight that occurs between ascent and descent, the phase that the plane is in for the majority of the flight. The remaining visibly darker columns include approach, maneuvering, and takeoff, which are three of the main parts of flight.
Expectedly, most aircrafts that have fatal accidents are those where the aircraft gets destroyed.
# Function to calculate the total accidents in a category over time

def sum_over_time(df, category):

totals = []

keys = []

years = []

for k, g in df.groupby(['year', category]):

(yr, cat) = k

totals.append(len(g))

keys.append(cat)

years.append(yr)

dict_to_plot = {

category : keys,

'Total': totals,

'Year': years

}

return dict_to_plot
# Total Over time

t = sum_over_time(my_data, 'Fatal_Bool')
# Tracking fatalities over time

from bokeh.charts import Line, show, output_file

x = t['Year']

t_df = pd.DataFrame(t)

p = figure(plot_width=800, plot_height=800, title ="Number of Accidents Reported")

# Fatal

fat = t_df[t_df['Fatal_Bool'] == 'Fatal']

# Unknown

uk = t_df[t_df['Fatal_Bool'] == 'Unknown']

# Nonfatal

nonfat = t_df[t_df['Fatal_Bool'] == 'None']

p.line(fat['Year'], fat['Total'] , legend="Fatal",

line_color="red")

p.line(uk['Year'], uk['Total'] , legend="Not Reported",

line_color="navy")

p.line(nonfat['Year'], nonfat['Total'] , legend="Not Fatal",

line_color="green")

show(p)
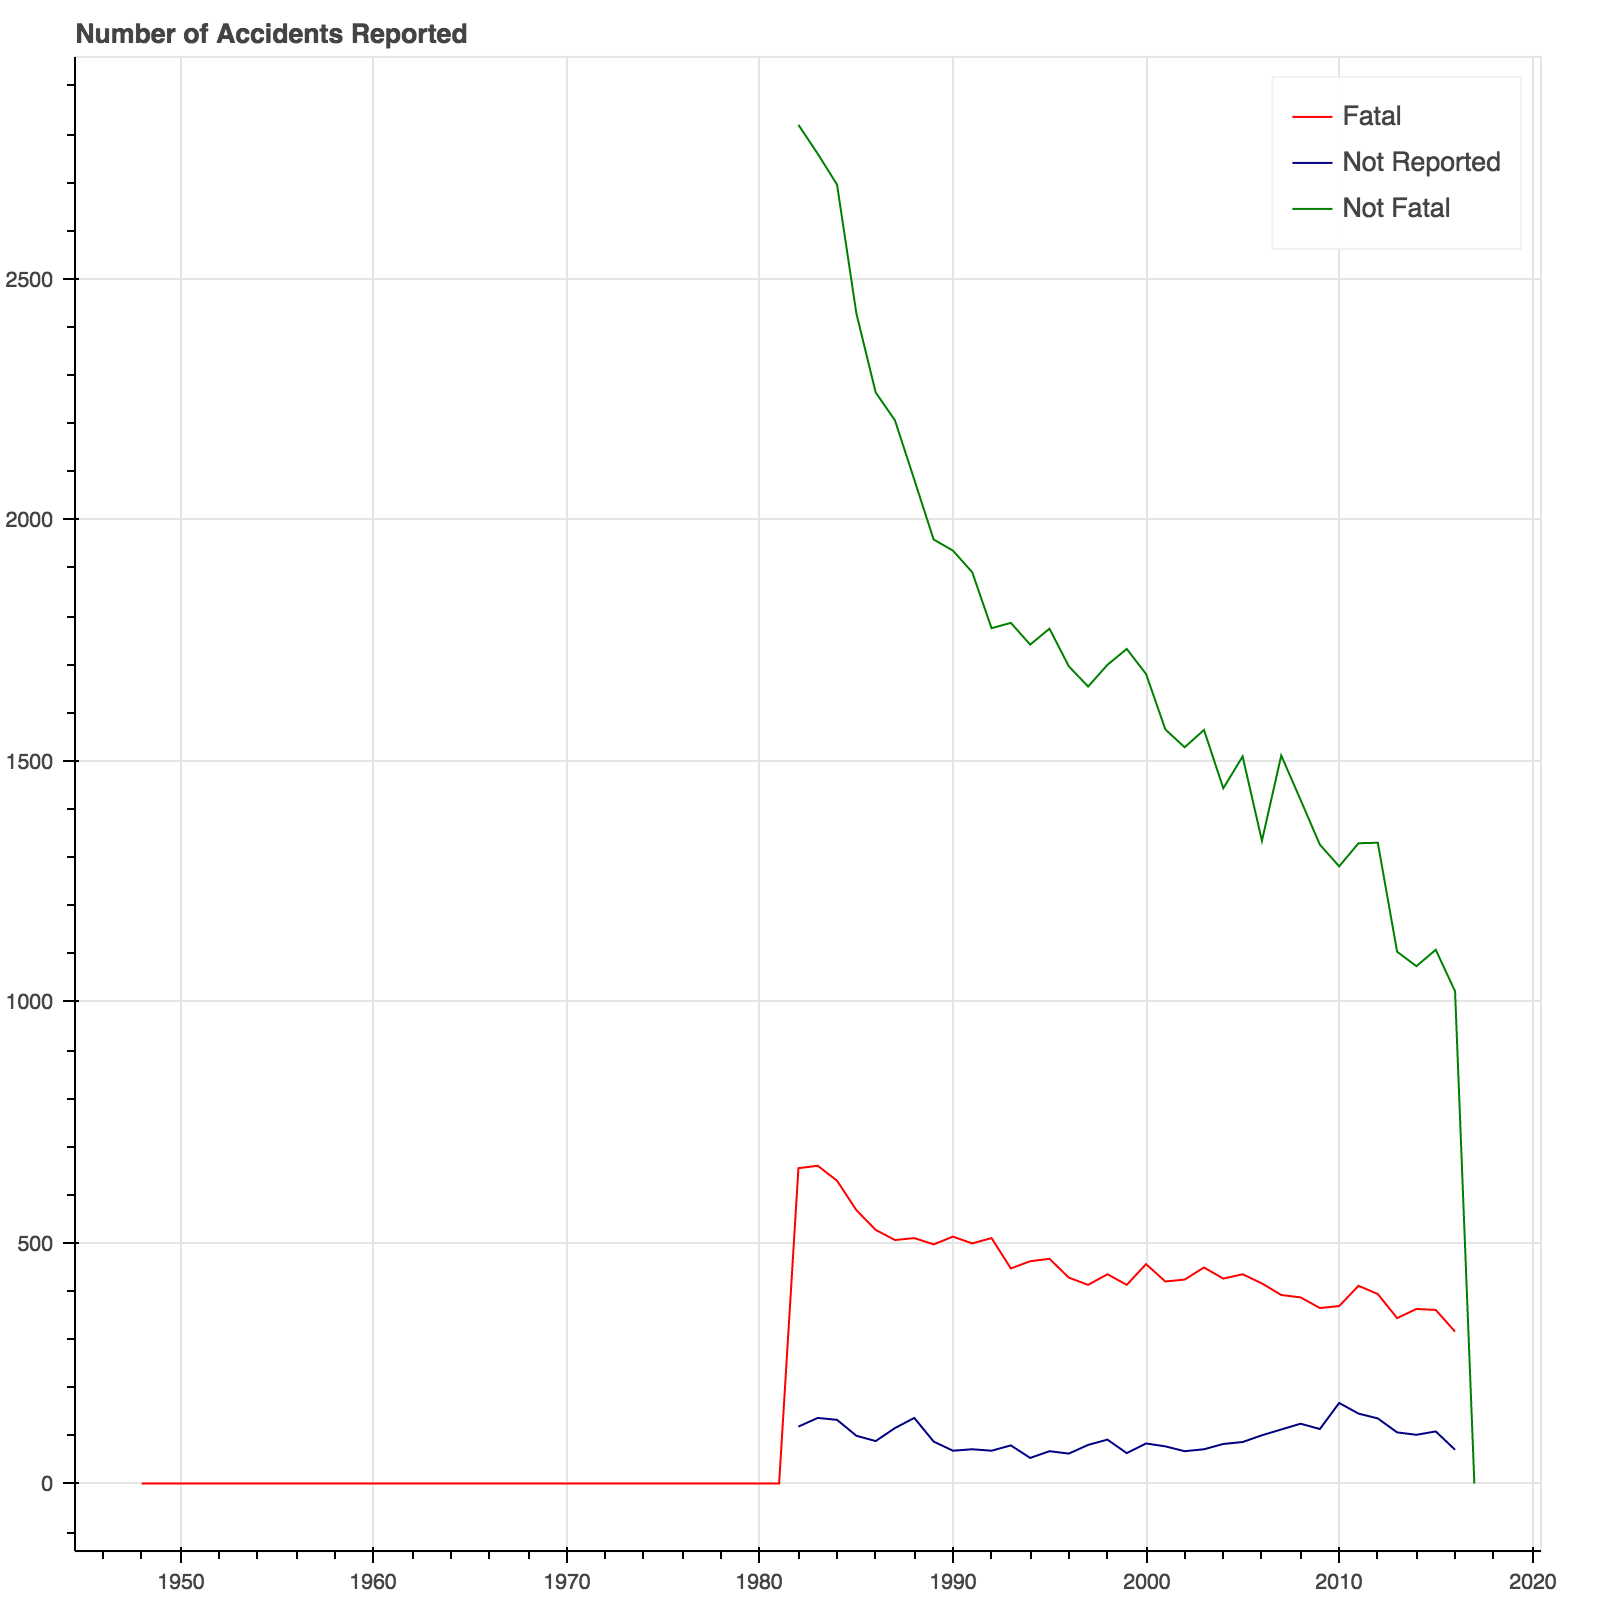
Following the heat maps, I was interested in seeing if fatalities or accidents in general tend to be decreasing over the years. With the vast improvement in technology, I would expect that aircrafts are getting safer each day. The number of accidents overall is definitely decreasing, however the number of accidents that have at least one fatality is not decreasing as rapidly, but it is decreasing. Disclaimer: graph appears to drop suddenly, but that is only due to the fact that 2017 just started!
It seemed curious as to why there was such a jump in the 1980’s. I decided to sort the accidents by their year to inspect the accidents with the earliest years.
my_data.sort_values(by=['year'])[:15]
| Location | Country | Latitude | Longitude | Aircraft.Damage | Make | Model | Amateur.Built | Number.of.Engines | Engine.Type | FAR.Description | Purpose.of.Flight | Total.Uninjured | Weather.Condition | Broad.Phase.of.Flight | year | month | Fatal_Counts | Fatal_Bool | |
|---|---|---|---|---|---|---|---|---|---|---|---|---|---|---|---|---|---|---|---|
| 79292 | MOOSE CREEK, ID | United States | NaN | NaN | Destroyed | STINSON | 108-3 | No | 1.0 | Reciprocating | NaN | Personal | 0.0 | UNK | CRUISE | 1948 | 10 | 2.0 | Fatal |
| 79291 | BRIDGEPORT, CA | United States | NaN | NaN | Destroyed | PIPER | PA24-180 | No | 1.0 | Reciprocating | NaN | Personal | 0.0 | UNK | UNKNOWN | 1962 | 07 | 4.0 | Fatal |
| 79290 | Saltville, VA | United States | 36.922223 | -81.878056 | Destroyed | Cessna | 172M | No | 1.0 | Reciprocating | NaN | Personal | NaN | IMC | CRUISE | 1974 | 08 | 3.0 | Fatal |
| 79289 | EUREKA, CA | United States | NaN | NaN | Destroyed | Rockwell | 112 | No | 1.0 | Reciprocating | NaN | Personal | 0.0 | IMC | CRUISE | 1977 | 06 | 2.0 | Fatal |
| 79288 | Canton, OH | United States | NaN | NaN | Destroyed | Cessna | 501 | No | NaN | NaN | NaN | Personal | NaN | VMC | APPROACH | 1979 | 08 | 1.0 | Fatal |
| 79287 | COTTON, MN | United States | NaN | NaN | Destroyed | CESSNA | 180 | No | 1.0 | Reciprocating | NaN | Personal | 0.0 | IMC | UNKNOWN | 1981 | 08 | 4.0 | Fatal |
| 76898 | ANCHORAGE, AK | United States | NaN | NaN | Substantial | CESSNA | 336 | No | 2.0 | Reciprocating | Part 91: General Aviation | Business | 1.0 | VMC | LANDING | 1982 | 08 | 0.0 | None |
| 76897 | EAGLE RIVER, AK | United States | NaN | NaN | Substantial | PIPER | PA-38-112 | No | 1.0 | Reciprocating | Part 91: General Aviation | Personal | 2.0 | VMC | MANEUVERING | 1982 | 08 | 0.0 | None |
| 76896 | PLYMOUTH, MI | United States | NaN | NaN | Substantial | DRAGON FLY | NaN | Yes | 1.0 | Reciprocating | Part 91: General Aviation | Personal | 1.0 | VMC | LANDING | 1982 | 08 | 0.0 | None |
| 76895 | DURANGO, CO | United States | NaN | NaN | Substantial | CESSNA | 172N | No | 1.0 | Reciprocating | Part 91: General Aviation | Instructional | 1.0 | VMC | LANDING | 1982 | 08 | 0.0 | None |
| 76894 | YUMA, CO | United States | NaN | NaN | Substantial | BELLANCA | 7GCBC | No | 1.0 | Reciprocating | Part 91: General Aviation | Personal | 1.0 | VMC | LANDING | 1982 | 08 | 0.0 | None |
| 76893 | 15MI. NE OF CHR, CO | United States | NaN | NaN | Destroyed | PIPER | PA-28RT-201T | No | 1.0 | Reciprocating | Part 91: General Aviation | Personal | 1.0 | VMC | CRUISE | 1982 | 08 | 0.0 | None |
| 76892 | EL PASO, TX | United States | NaN | NaN | Minor | CESSNA | 421B | No | 2.0 | Turbo Prop | Part 91: General Aviation | Business | 0.0 | VMC | DESCENT | 1982 | 08 | NaN | Unknown |
| 76891 | BUENA PARK, CA | United States | NaN | NaN | Substantial | CESSNA | T210L | No | 1.0 | Reciprocating | Part 91: General Aviation | Personal | 1.0 | VMC | TAKEOFF | 1982 | 08 | 0.0 | None |
| 76890 | GAINESVILLE, FL | United States | NaN | NaN | Substantial | CESSNA | 210 | No | 1.0 | Reciprocating | Part 91: General Aviation | Personal | 0.0 | VMC | CRUISE | 1982 | 08 | 0.0 | None |
After reviewing the dataframe, I can see that the earliest accidents reported were all personal flights, with only 5 flights taken into consideration between 1948 - 1981. It would be expected that the accidents reported jump as the commercial aviation industry grew, so the jump in the data is not alarming.
Map
Now that I have an idea of trends over time I wanted to see if there were certain regions which had the tendency to have more accidents. There were too many accidents to map on folium, so I took a subset of those accidents reported in 2016. Those with a red marker indicate that the accident had at least one fatality, while a green marker represents that there were no fatalities.
subset_data = my_data[['year', 'month', 'Latitude', 'Longitude', 'Aircraft.Damage', 'Fatal_Bool', 'Fatal_Counts']]

subset_data.dropna(inplace=True)

subset_data['year'] = subset_data['year'].astype(int)

recent = subset_data[subset_data['year'] >= 2016]

map_ = folium.Map(location =[40,-90], zoom_start = 2)

for i in range(len(recent)):

lon = recent.iloc[i]['Longitude']

lat = recent.iloc[i]['Latitude']

month = recent.iloc[i]['month']

year = recent.iloc[i]['year']

fatal = recent.iloc[i]['Fatal_Bool']

damage = recent.iloc[i]['Aircraft.Damage']

count = recent.iloc[i]['Fatal_Counts']

popup_str = "Fatal Count " + str(count)

if fatal == "Unknown":

folium.Marker([lat, lon], popup=popup_str).add_to(map_)

if fatal == "Fatal":

map_.simple_marker([lat, lon], popup=popup_str, marker_color='red', marker_icon='remove-sign')

if fatal == "None":

map_.simple_marker([lat, lon], popup=popup_str, marker_color='green', marker_icon='ok-sign')
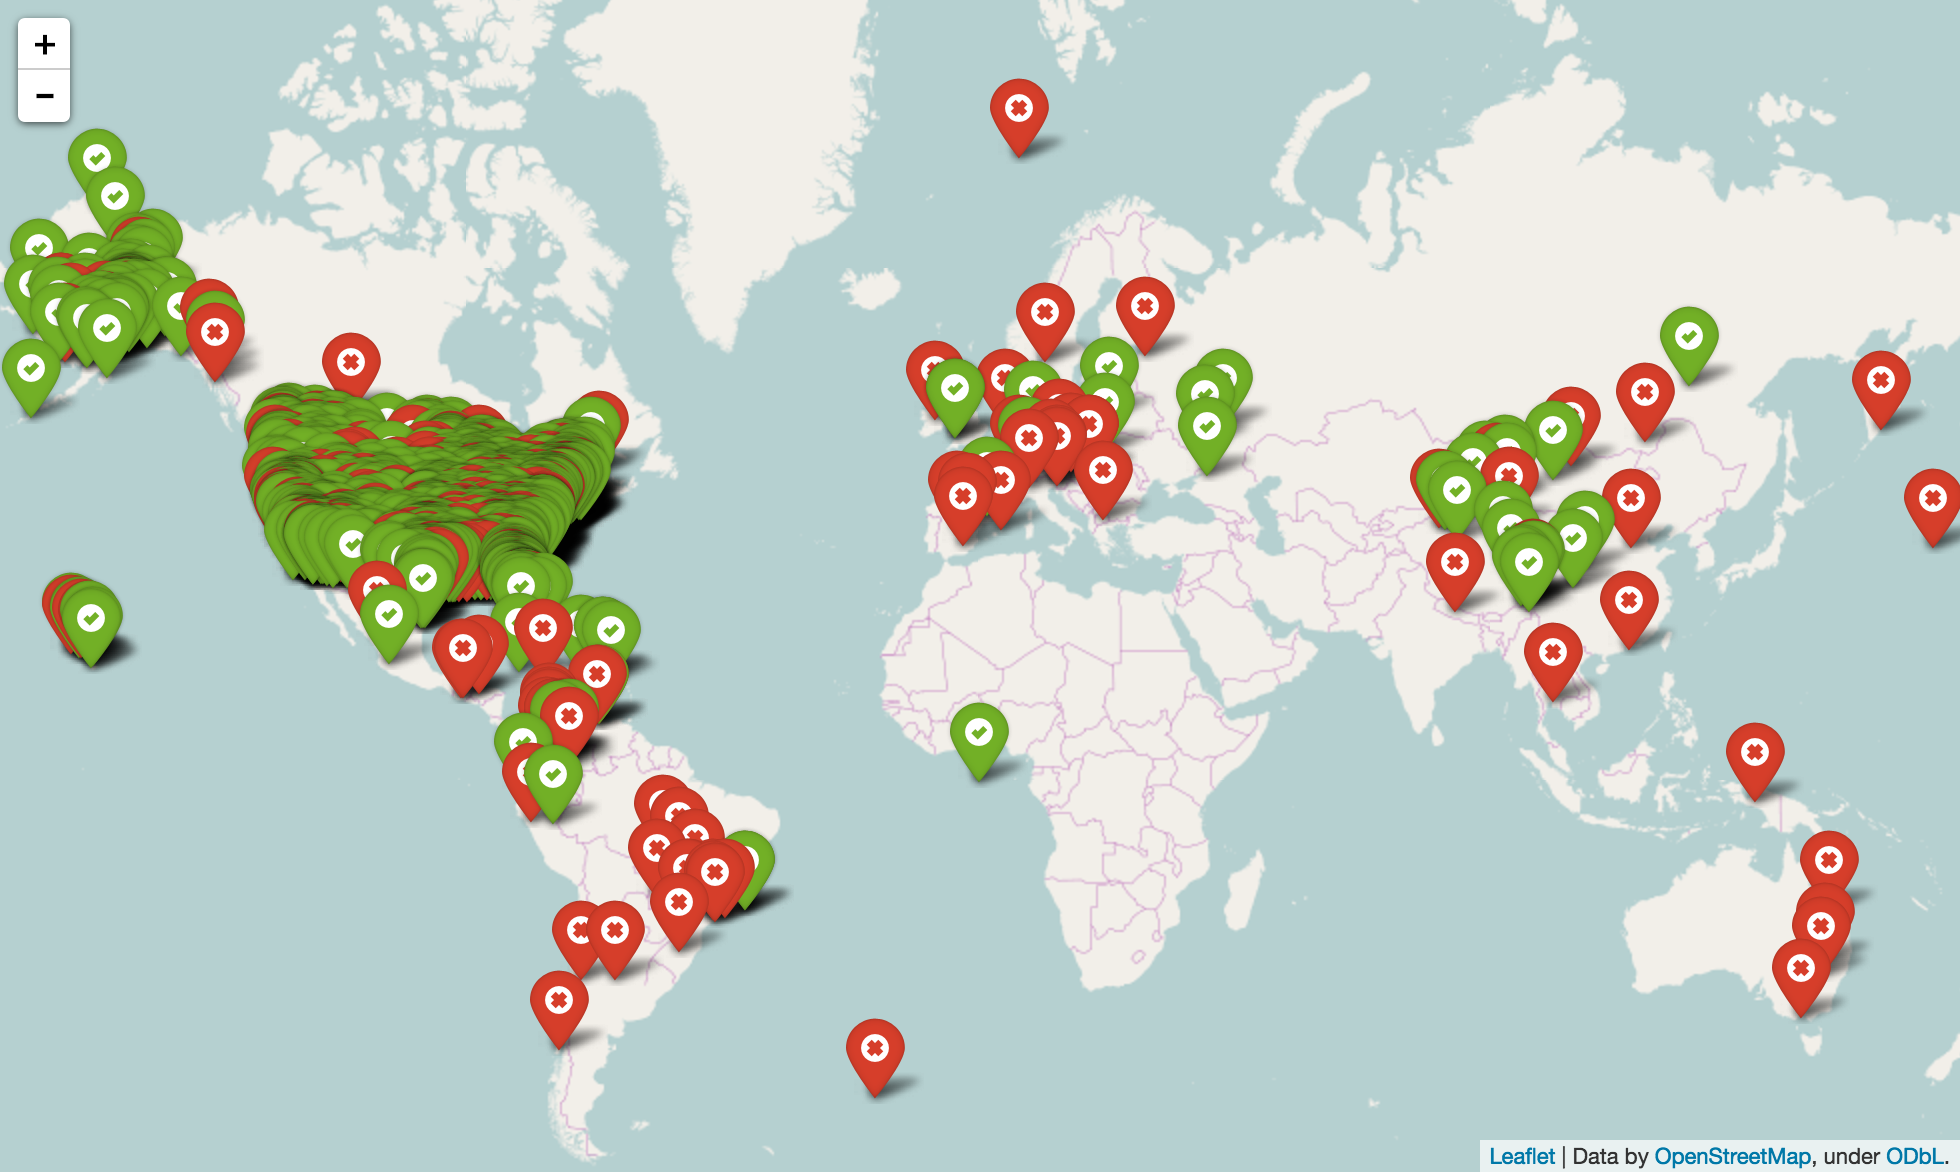
This graph pinpoints the locations of 1,214 accidents in 2016. While most of the incidents occur in the United States, we do see more green than red. When we observe the incidents outside of the U.S., there is slightly more red than green, meaning more fatalities outside of the U.S.
Conclusion
My main purpose for this data analysis was to investigate trends associated with aircraft accidents. I was surprised that most accidents occur when the weather is clear enough for pilots to navigate the plane themselves and that there are so many incidents every year. Thankfully, the number of non-fatal accidents greatly outnumbers the number of fatal accidents, and both do appear to be decreasing. One key factor that this dataset did not include was the determined cause of the accident. In the future, combining this analysis with data containing the cause of the accident could yield more impactful results as to why we are still having so many accidents.